Oct 19, 2021
Version 2
Titan Clear Labs SARS-CoV-2 Strain Characterization Workflow for the Terra Platform V.2
This protocol is a draft, published without a DOI.
- Frank J Ambrosio1,
- Jill V Hagey2,
- Kevin Libuit1,
- Technical Outreach and Assistance for States Team2
- 1Theiagen Genomics;
- 2Centers for Disease Control and Prevention
- TOAST_publicTech. support email: toast@cdc.gov


Protocol Citation: Frank J Ambrosio, Jill V Hagey, Kevin Libuit, Technical Outreach and Assistance for States Team 2021. Titan Clear Labs SARS-CoV-2 Strain Characterization Workflow for the Terra Platform. protocols.io https://protocols.io/view/titan-clear-labs-sars-cov-2-strain-characterizatio-by75pzq6Version created by Technical Outreach and Assistance for States Team
License: This is an open access protocol distributed under the terms of the Creative Commons Attribution License, which permits unrestricted use, distribution, and reproduction in any medium, provided the original author and source are credited
Protocol status: In development
We are still developing and optimizing this protocol
Created: October 19, 2021
Last Modified: October 19, 2021
Protocol Integer ID: 54237
Keywords: ONT, Nanopore, SARS-CoV-2, MinION, GridION, PromethION, MK1C, Pangolin, Genomics, Analysis, Virology, Bioinformatics, RNA, DNA, Clear Labs, Covid, Computational Biology, Sequencing, Clear Labs, Hamilton, public health viral genomics titan series, additional technical documentation for the titan-clearlabs workflow, input data for titan-clearlab, titan clear labs sar, titan-clearlabs data, titan-clearlabs workflow, consensus genome assembly, titan-clearlabs run, titan-cleanlab, consensus genome, theiagen genomic, generated consensus genome, titan-clearlab, genomic, data for sar, clade designation, bed file format, primer sequence coordinates of the pcr scheme, titan, terra platform, pcr scheme, cear labs fastq, clade, quality of both raw read data, pcr
Disclaimer
The opinions expressed here do not necessarily reflect the opinions of the Centers for Disease Control and Prevention or the institutions with which the authors are affiliated. The protocol content here is under development and is for informational purposes only and does not constitute legal, medical, clinical, or safety advice, or otherwise; content added to protocols.io is not peer reviewed and may not have undergone a formal approval of any kind. Information presented in this protocol should not substitute for independent professional judgment, advice, diagnosis, or treatment. Any action you take or refrain from taking using or relying upon the information presented here is strictly at your own risk. You agree that neither the Company nor any of the authors, contributors, administrators, or anyone else associated with protocols.io, can be held responsible for your use of the information contained in or linked to this protocol or any of our Sites/Apps and Services.
Abstract
The Titan_ClearLabs workflow is a part of the Public Health Viral Genomics Titan series for SARS-CoV-2 genomic characterization. Titan_CleanLabs was written to process Clear Labs read data for SARS-CoV-2 ARTIC V3 amplicon sequencing. Upon initiating a Titan_ClearLabs run, input read data provided for each sample will be processed to perform consensus genome assembly, infer the quality of both raw read data and the generated consensus genome, and assign lineage or clade designations as outlined in the Titan_ClearLabs data workflow below.
Additional technical documentation for the Titan_ClearLabs workflow is available at:
Titan workflow for use with Clear Labs sequencing read data
Required input data for Titan_ClearLabs:
Cear Labs FASTQ read files (single FASTQ file per sample)
Primer sequence coordinates of the PCR scheme utilized in BED file format
Video Instruction:
Theiagen Genomics: Titan Genomic Characterization
Theiagen Genomics: Titan Outputs QC
For technical assistance, please contact us at: TOAST@cdc.gov
Attachments

Troubleshooting
Setup Terra and Google Cloud Accounts
Note
The Terra platform registration requires a Google account. If you have a Google account you can sign in using the Terra login page:
Welcome page for Terra.bio.
Click on the three parallel lines in the top left-hand corner and click the 'Sign in with Google' button.
Terra.bio welcome page with selection panel open.
If you do not have Google email you can set up a Google account with a non-Google email. The steps to do this are described in the following link:
Note
The Terra platform uses the Google Cloud to run workflows and store data. The following documentation will describe how to set up a Google Cloud account:
Note
To link your Terra platform account with your Google Cloud account follow the instructions provided in the following link:
Scroll down to Section 3 titled "Create a Terra Billing Project" and follow the instructions. It is important to note that the name you give to your Terra Billing Project must be unique across all Google Billing Projects. If the name provided is not unique, it won't immediately throw an error, but instead will not complete the process of associating the Google Billing account with the Terra Billing Project. If this occurs, cancel the process and set up a new Terra Billing Project.
Import Titan Clear Labs workflow from Dockstore
Importing the Titan Workflow from Dockstore to the User Workspace
The Titan Clear Labs workflow is hosted in the Theiagen Dockstore (https://dockstore.org/) repository and has to be imported into the user's Terra Workspace. Begin by clicking on the three parallel lines in the top left-hand corner, followed by clicking the 'Library' tab and finally click the 'Workflows' button.
'Workflows' button listed under the 'Library' tab in the selection panel
In the 'Workflows' panel, under 'Find Additional Workflows' click on the 'Dockstore' link in the grey box on the right side of the page.
Workflows panel with link to Dockstore
On the left side of the Dockstore page search for 'theiagen/public_health_viral_genomics/Titan_ClearLabs' in the pull-down search bar.
Search result for theiagen/public_health_viral_genomics/Titan_ClearLabs
Click the 'theiagen/public_health_viral_genomics/Titan_ClearLabs' link. This will take you to a page where you can import the workflow into your workspace.
Dockstore link to terra
On the right-hand side of the page under the 'Launch with' window, click the 'Terra' button. It should bring you back to the Terra platform within the 'Import Workflow' page.
Terra.bio import workflow page
Under 'Destination Workspace,' click the 'create a new workspace' button. A pop-up window titled 'Create a New Workspace' should appear. Name your new workspace and associate it with a billing account using the 'Billing project' drop-down menu. The Terra Billing Account you created in the previous step should be available. Finally, click the 'Create Workspace' button.
Create new workspace panel
After clicking the 'Create Workspace' button you should be automatically directed to the Titan Clear Labs workflow panel in the new workspace page that was just created.
Upload Fastq Sequence Files
There are three options for uploading your files:
1. Upload on Terra (can only do single files).
2. Upload to Google bucket and link to Terra (can do single files or bulk files/folders).
Upload fastq sequence files one at a time to be used in the analysis
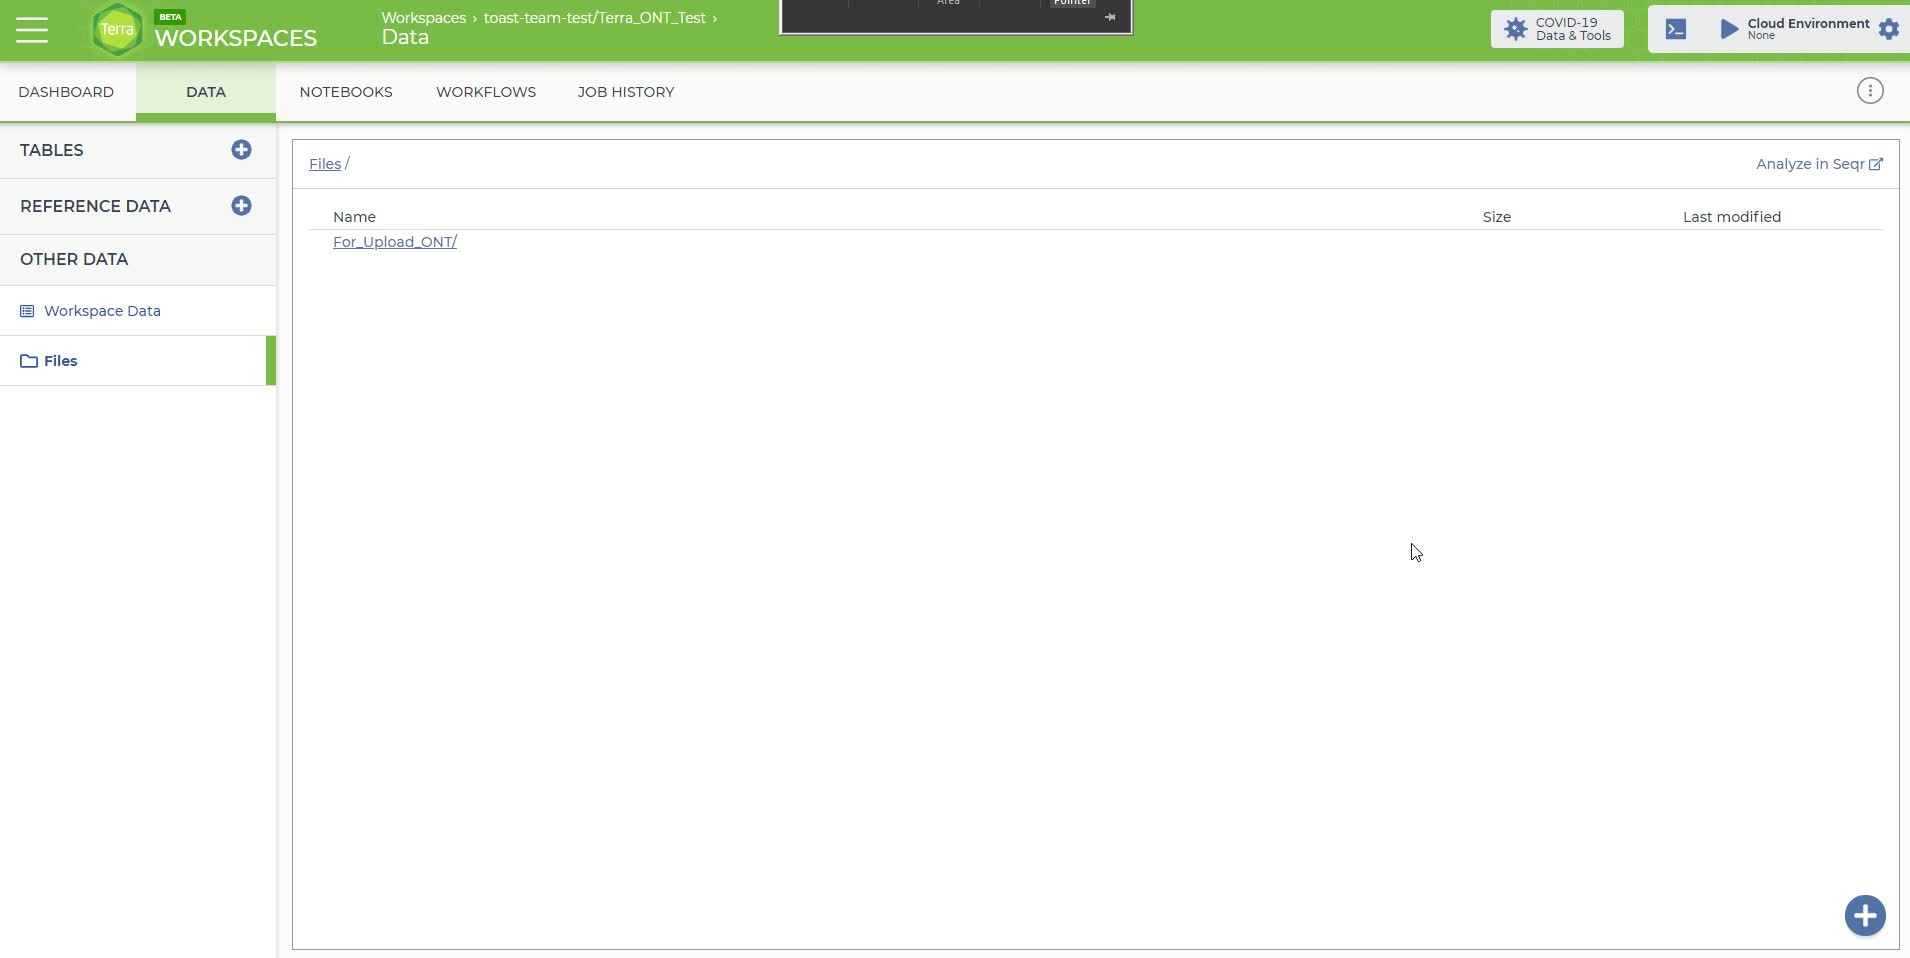
Click on the 'Data' panel in the newly created workspace and then click on the 'Files' tab
The 'Files' tab within the 'Data' panel of the newly created workspace
Once in the 'Files' tab, you can either just drag and drop your files into this space or move the mouse over the blue plus sign icon in the bottom right-hand corner and click 'upload'. Upload the sequence files you'll need for this analysis. Each fastq sequence file has to be uploaded individually using this method.
Dragging and dropping files for upload
Once the files are uploaded, you will need to bring a table in to associate your files with their corresponding link to their google bucket location.
Note
The Terra sample table file has to follow a specific template. We've provided the template file here  Terra_ClearLabs_Table_Upload.tsv as a downloadable tab-separated (or .tsv) file. The tab-separated table has three columns: entity:sample_id, Reads.
Either by editing the text file or using spreadsheet software like Excel, fill in each column with the required information. The first column 'entity:sample_id' is the sample name that is provided by the user. The second columns, Reads are the file paths where the fastq files are stored within the Google Cloud.
While you had to upload your samples individually, you can have all your samples in one datatable.
To identify the Google Cloud location, right-click on each fastq file that was uploaded in the previous step and copy the link address. The file path should look like something similar to the following:
gs://fc-b1e3191a-3d9f-43fe-9743-255551ce2f38/F_1.fastq.gz
When completed, the table should look similar to the following:
Example Terra sample file
Once the table is filled with the required information, be sure to save it as a tab-separated (or tsv) file. The spreadsheet software should have an option to save as a 'tsv' file.
Note: When uploading additional sample table files to the same workspace, the entity types must be unique and end in "_id" (e.g. sample1_id, sample2_id etc.)
Finally, the completed Terra sample file will need to be uploaded to the newly created Cecret* workspace. On the right-hand side of the workspace 'Data' panel there is a 'Tables' tab. Click the blue plus sign icon on the right edge of the 'Tables' tab. A popup window should appear titled 'Import Table Data'. Select your completed tab-separated sample file for upload and then click the 'Upload' button.
The 'Import Table Data' window for uploading the Terra sample file
If the upload is successful then the sample file should be located under the 'Tables' tab as 'sample (#)' where # is the number of samples in your file.
The workspace 'Data' panel after successfully uploading the fastq sequence files and Terra sample file
Here is a video showing the process.
You will likely have many samples to upload and you can do this by going directly to your Google bucket.
First, go to “DASHBOARD” tab in your workspace and click “Google Bucket” at the bottom right corner of the same page.
The Dashboard tab of your workspace.
This will direct you to your “Google Cloud Platform” page for data uploading. Click “UPLOAD FILES” in the middle of this page to upload single or multiple fastq files. You can click “UPLOAD FOLDER” to upload a folder with multiple fastq files stored inside. Or you can just drag and drop files onto the page. This will cost some google cloud credits (e.g.4.4 Gb for $0.75).
Google bucket page drag and drop for uploading files and folders.
Go back to your Terra account and click “DATA” tab. The successfully uploaded fastq files will show up. If the upload is successful then the sample file should be located under the 'Tables' tab as 'sample (#)' where # is the number of samples in your file.
Recently uploaded data.
To upload via the Terra Data Uploader
Landing page of the Terra Data Uploader
Select the Terra Workspace to which you would like to upload your fastq files. This will be the same workspace created in the previous step.
Click the '+ Create a new collection' link and enter a name for your new collection of fastq files. DO NOT INCLUDE SPACES IN THE COLLECTION NAME, use underscores instead. Spaces will cause an error later in the pipeline.
Note
Go to step 10 to see an example error caused by spaces present in the collection name. The process will also show you how to investigate a job failure.
Click the 'Create Collection' button and you will be routed to the data uploader page where you can drag and drop fastq files directly into your browser window to initiate upload.
Drag and drop the fastq files that you would like to upload into the upload space.
Once your files have been successfully uploaded, select "NEXT>" to proceed to the metadata upload page
To upload a metadata table and create a Terra sample table in your workspace, open Excel and populate your spreadsheet with the root entity designation in A1, and "reads" in B1 as headers; underneath these headers, proceed to populate each row with the sample names in column A and the corresponding filename that was uploaded in column B.
NOTE: In this example, our root entity type is "Test_ClearLabs_sample_id" so, in cell A1, we have written "entity:Test_ClearLabs_sample_id". A "root entity" is the smallest piece of data a workflow can use as input. The root entity is always defined with "entity:" and must always end in "sample_id"
Important note on column names: DO NOT USE SPACES! As we did before in creating our workspace and collection names use "_" instead of spaces! The first column MUST have the start with "entity:" and end with "sample_id", you can call the other columns whatever you like, but we recommend you use something that denotes that the column contains a reads file for clarity.
An example minimal metadata file
Note
You can have as many columns as you want in addition to the "entity:sample_id" and "reads" columns. Some examples you might want to include are:
- Ct value
- Sequencing run or plate ID
- Sampling or extraction dates
If you plan to use the Augur protocol or visualize your data with UShER or Auspice, consider including that metadata in the file you upload now. Required columns for Augur are described here:
and include:
- Collection_date
- iso_country
- iso_state
- iso_continent
- iso_county
Date columns, sequencing date for example, must use the format YYYY-MM-DD.
Whatever additional columns of metadata you populate to this Terra data table will, after a Titan run, get populated to that same table as the final Titan output. You can then use this data to correlate assembly quality with CT values to determine cutoff thresholds for which samples to actually sequence in the future or identify issues that are sequence run specific.
If you plan to also use the Mercury workflow to prepare sequence and metadata for submission to public repositories (GISAID, GenBank and SRA) then populating this sheet now will make running the Mercury workflow easier.
Save this sheet as a tab delimited file text file
An example, metadata table is found below.
Note
This example file has the minimum amount of columns to be able to create a collection. Delete the sample names and populate the document with your own.
When opening this file in Excel, check the box for "my data has headers" in step 1 of the text import wizard and then click "next".
Step 1 in the pop up window
In step 2, select "Tab" as the delimiter. Click "next" and then click "finish." Now you can edit!
Step 2 of the pop window
Drag and drop your metadata table to the Terra #Upload page and select CREATE TABLE to complete the process
Running the Titan_ClearLabs Workflow
To run the Titan_ClearLabs workflow, click on the 'Workflows' panel in the newly created workspace. It should bring you to your workflow page. Click on the 'Titan_ClearLabs' tile to bring up the Titan_ClearLabs assembly workflow page.
This will bring up the Titan_ClearLabs workflow page:
The Titan ClearLabs assembly workflow page
Select the version of the workflow you would like to run. Double check that you are using the latest version of the workflow. Alternately, you may specify another version, but should only pick a stable version (with numbers) NOT a 'main' or 'dev' version.
Ensure that "Run workflow(s) with inputs defined by data table" is selected and the "Use call caching" is checked and then select the root entity type for the data you wish to analyze
NOTE: Call caching allows Terra to identify and skip jobs that have been run previously; this option is by default enabled to avoid unnecessary compute costs. More information on Terra call caching, including examples of when you may want to disable this feature, is available through the Terra Support Documentation.
Click "SELECT DATA" and choose the samples you wish to analyze
Complete the INPUTS form with the appropriate attributes
The top two rows represent variables that have to be provided by the user. This was the information that we populated the sample data table with in the previous step.
In our example, for the first row, the 'demultiplex_reads' variable, we clicked on the 'Attribute' text box and wrote 'this.reads' to indicate that the 'demultiplex_reads' we wish to analyze are under the 'reads' column of our selected datatable. In the second row, the 'samplename' variable, we selected on the 'Attribute' text box and wrote 'this.Test_ONT_sample_id' to indicate the 'samplename' of each sample we are analyzing can be found in the `Test_ONT_sample_id' column of our selected datatable.
NOTE: If you named your columns something other than reads then just type "this." followed by whatever the column name is. We would advise naming your reads column "reads" for clarity.
Once your input form is complete, move on to the OUTPUTS form and select "Use Defaults'. Terra will then populate the OUTPUTS form with all of the default outputs options generated by the workflow. If you forget to do this you won't have easily accessible results! Save these changes by clicking the 'Save' button.
Once your INPUTS and OUTPUTS forms are complete, click the 'Save' button on the top right-hand side of the page. The yellow caution icons should disappear and the Run Analysis option should be made available.
You are now ready to run the Titan_ClearLabs workflow! Click on the 'Run Analysis' button to the right of the 'Outputs' tab. A popup window should appear titled 'Confirm launch'. If the 'Run Analysis' button is greyed out, you need to save your recent changes by clicking the 'Save' button.
Clicking the 'Launch' button should bring you to the 'Job History' panel where each sample will be queued for the Titan_ClearLabs analysis. The status will change from queued to submitted to running.
Job history screen after launching Terra job
View and Download the Titan Output Report
First, verify all of the samples have completed the analysis run by looking at the 'Workflow Status' section in the top left of the 'Job History' panel. The job has completed when all the samples have a status of 'succeeded' with a green checkmark.
The 'Job History' panel when the job has completed
Then go to the 'Data' panel and under the 'Tables' tab click on the sample table that you created and uploaded in step 4. It will be named 'sample (#)' where # is the number of samples in your file.
The Terra sample table with the added output attributes from the Titan ONT run
Now the Terra sample table will have the additional attributes that were added by the workflow when you specified the output names (set to default in this example). You can reduce the number of fields you want to visualize by clicking the "gear" icon in top row on the right. Select only the fields you want to see then click "Done".
Click gear for pop up menu of outputs.
An explanation for what each output column is can be found in the Theiagen documentation under "outputs".
Selecting only metrics we want to see.
To download the consensus sequence for a particular sample, click on the link in the 'assembly_fasta' attribute column and a popup window titled 'File Details' should appear. Click the 'Download For < $0.01' button, which will download the consensus sequence to your local directory. This can be uploaded to NextClade to visualize if desired (see step 9).
The 'File Details' popup window for downloading consensus sequence.
The NextClade and Pangolin lineage assignments determined by the pipeline can be viewed in the Terra sample report by scrolling to the right (or just only selecting those columns using the "gear" icon). You can download or copy this report by using either the 'Download All Rows' or 'Copy Page To Clipboard' buttons at the top of the table.
Nextclade assignments for the samples in 'nextclade_clade' column (column 2).
Pangolin lineage assignments for the samples in 'Pangolin_lineage' column (column 1).
Note, here we have one sample that was not assigned a pangolin lineage. We will need to look at more our metrics to understand why.
Note
Additional documentation for the Titan SARS-CoV-2 workflows and the Terra platform are available.
Titan workflows: Theiagen Genomics Documentation
Terra Platform: Documentation – Terra Support
Reviewing Quality Metrics
Ideally, at the end of this process, we would have a complete consensus assembly sequence, which represents the entirety of the RNA sequence that was present in the virion in the sample. However, often a full length sequence is not generated at the end of the protocol, but rather fragments of the genome. We can look at metrics to determine how fragmented our genome is relative to the reference sequence. There are 3 metrics in our report to help us assess this.
Assembly length unambiguous - the final count of ATCGs (i.e. unambiguous bases) within the consensus assembly.
- A higher number here will indicate a more complete consensus sequence.
Assembly length unambiguous metric in the output
Here we see that the second sample has only 6,671bp that were unambiguous (A,T,C, or G), which means much of the genome was not able to be recovered through sequencing.
Number of Ns - the converse of assembly length unambiguous - It is the final count of the number of Ns (i.e. ambiguous) bases. These are completely ambiguous bases due to either too little signal or too much noise for the basecaller to confidently determine what base was at this position.
- If there was an "S" (basecaller couldn't tell if it was an C or G) or "W" (basecaller couldn't tell if it was an A or T) these counts are considered "semi-ambiguous" and are not included in either the number of N or assembly length unambiguous metrics.
- A higher number of Ns will mean you have a more fragmented assembly. Less Ns is a strong consensus assembly.
Percent reference coverage - Portion of the genome covered by consensus assembly. This uses the assembly length unambiguous metric to gauge how much of the reference sequence (Wu Han-1) is covered by the consensus assembly.
- Takes the #ATCG/length of SC2 reference genome (29903bp)*100
Ideally this should equal 100%, indicating that the assembly covered 100% of the reference genome length, unambiguously.
Metrics on the number of Ns and percent reference coverage.
From these metrics we can see that there is a large number of bases that are Ns (23,232bp), which translates to only 22.31% of the reference genome covered by the sequencing in the second sample. Taken together these metrics indicate that much of the genome sequence is unknown in the second sample, which explains why we were unable to get a pangolin lineage assignment for this sample. The troubleshooting metrics can help determine what caused this.
Metrics for Troubleshooting
Pool 1 and 2 Representation (not available in all workflow versions)
We can look at how much read data was generated from each primer pool by looking at the pool 1 and pool 2 percentages. This well help identify if a PCR reaction failed. You want the ratio to be roughly 40:60 in either direction. If there is a 10:90 or 20:80 ratio this is a strong indication that one of the PCR reactions failed and resequencing should be considered to generate a confident consensus sequence for that sample.
The percent of the reads in a sample that came from each pool.
The fact that in the second sample 80% of reads came from pool 1 is an indication that there was a failure to amplify pool 2 in the second sample, which lead to much of the genome not being sequenced in that sample. In contrast, in the first sample there is roughly an even split of the number of reads coming from each primer pool, which is ideal.
FastQC Raw Output
These data are the number of raw reads in an input file and indicates how much sequencing occurred.
Number or raw reads that resulted from the sequencing run.
These data show that the second sample had significantly fewer reads from the sequencing run. This was another reason the genome that was assembled from the second sample was so fragmented.
Percent of Reads Identified to be Human and SARS-CoV-2
These data indicate how much human read contamination is in the sequencing reads. Ideally, the number of reads containing human data should be as low as possible and the percent of reads assigned SARS-CoV-2 should be high. If the sequencing run contains greater than ~15% human reads, the concentration of SARS-CoV-2 in your original sample may be too low to generate sufficient coverage depth for a good quality assembly, or there is an issue in the wet lab protocol that is leading to the low generation of SARS-CoV-2 reads.
Output from the program "Kraken" that identifies the number of human and SARS-CoV-2 reads in a sample.
The first sample is fairly free of contamination, with 99.76% of the sequenced reads belonging to SARS-CoV-2. However, in the second sample there is a high amount of contamination, with 25.37% of reads belonging to human and only 54.19% of reads determined to be of SARS-CoV-2 origin. Thus, there is roughly ~21% of reads that are some other source of contamination that is not human. If a lab is having consistent problem with contamination that is not identified to be of human origin with this workflow, a larger Kraken database can be used to determine the offending organism. Contact TOAST@cdc.gov if you would like assistance with this or read Kraken2's documentation for how to do this on your own. Users should refer to their lab's cut offs for quality metrics to determine if a sample requires resequencing.
Bam File
This file is generated during alignment and contains all information regarding the alignment to the WuHan-1 reference. This file is found in the 'aligned_bam' column, and we can download this file just like we did with the consensus sequence in step 5. These files can be visualize this with Geneious, CLC workbench or IGV.
Submit Consensus Sequences to Public Repositories
If you plan on submitting the SARS-CoV-2 consensus sequence to either the GenBank or GISAID public repositories, please refer to the following documentation for submission criteria and minimum quality control thresholds.
GenBank Submission Criteria: About GenBank Submission (nih.gov)
GISAID Submission Criteria: Gisaid inclusion criteria.pdf
The Mercury workflows are designed to prepare genome assemblies and sample metadata on the Terra platform for subsequent GISAID and NCBI submission.
Mercury Overview: https://www.youtube.com/watch?v=h8YASVckOrw
After preparing consensus sequences of SARS-CoV-2 and sample metadata for submission, use the following protocols submit them to the public repositories. Completing submissions in this order allows all the sequence information to be linked together.
NextClade Visualization
After downloading consensus sequence for a particular sample following directions in Step 5, go to the NextClade website and drag-and-drop the downloaded fasta file. The screen will automatically take you to the analysis page.
Drag and drop file for analysis
Hover over the different columns to get more information. Click on the "Show Tree" button at the top right of the page to see where the sequence sits on the tree of other consensus sequences from SARS-CoV-2.
Clicking on 'Show Tree" button
The sequence is highlighted on the tree of SARS-CoV-2 consensus sequences.
Video of the full process:

How to debug a failed run
In this example of a failed run, we will look at what an error caused by adding spaces into your collection name looks like. If there is a failure for some other reason, you can follow similar steps to understand why your job failed. Here we will be using Illumina paired-end data, but the process of debugging an error is the same.
If a run fails, you will see this indicated on the job history screen in the "status" column.
Job Failure
To understand why it failed, click on the "workflow dashboard" icon in the "links" column. This will take you to a new screen and you can click the arrows next to the "message" to see what it says. Here we see there are two errors that direct us to a log file to check. To find out more click on the "execution directory" icon under the links header. This will take you to the google bucket with all the output from the run.
Job failure messages
Follow the file path in the google bucket to the log files that were referenced in the error messages (in red/orange text in the above photo).
Click on log file referenced in the error message.
Click on the "Authenticated URL" link that will take you to a text file.
Authenticated URL link
In the text file, we can see that there was an error that cause by there being a space between "Bad" and "Sample" in our file path that was created when we made "Bad Sample" rather than "Bad_Sample" as our collection name.
fastqc_raw.log file showing the error.
Video of the whole process.

Contact TOAST@cdc.gov for assistance with error messages and debugging job failures.