Apr 10, 2023
Sequence analysis of Nanopore based fungal and bacterial metabarcode DNA reads
- Rita.Tam 1,
- austin.bird 1,
- Benjamin Schwessinger1
- 1Australian National University


Protocol Citation: Rita.Tam , austin.bird , Benjamin Schwessinger 2023. Sequence analysis of Nanopore based fungal and bacterial metabarcode DNA reads. protocols.io https://dx.doi.org/10.17504/protocols.io.bp2l6969zlqe/v1
License: This is an open access protocol distributed under the terms of the Creative Commons Attribution License, which permits unrestricted use, distribution, and reproduction in any medium, provided the original author and source are credited
Protocol status: Working
We use this protocol and it's working
Created: April 08, 2023
Last Modified: February 06, 2024
Protocol Integer ID: 80200
Keywords: different wheat pathogen, plant pathogen diagnostic, wheat pathogen, sequencing fungal, fungal metabarcode, based fungal, identification of fungal spore, uninfected wheat plant, pathogen, bacterial metabarcode dna, length 16s rrna oxford nanopore sequencing data, major pathogen, fungal spore, bacterial metabarcode, rrna oxford nanopore sequencing data, level microbial community profiling, level microbial community profiling of full, fungi, specific nanopore, read sequencing data, genomic, sequencing chemistry, unite database for molecular identification, old wheat plant, analysis of nanopore, bacterial metabarcodes with native barcoding, pathogens for tg1, infective agent for each treatment group, nanopore, week old wheat plant, taxonomic assignment, sequencing, molecular identification, bacteria, details on the primer, bioinformatics, infective agent
Abstract
This protocols is part of the ANU Biosecurity mini-research project #1 "Plant Pathogen Diagnostics: Visuals, subcultures, and genomics".
You will be provided four pots of 3-4 week old wheat plants that have been infected with different wheat pathogens. Each pot has been infected with one major pathogen. You will not know which pot has been infected with which pathogen. However, you will be provided a compendium of 10-15 wheat pathogens that will guide you to identify the infective agent for each treatment group. The fifth treatment group will be uninfected wheat plants which will be clearly identified. You can use treatment group #5 as negative control for your experiments.
In total, each group will obtain five pots each:
| A | B | |
| Treatment group 1 | Unknown infective agent | |
| Treatment group 2 | Unknown infective agent | |
| Treatment group 3 | Unknown infective agent | |
| Treatment group 4 | Unknown infective agent | |
| Treatment group 5 | Uninfected control |
This specific protocol is a general description of how we analysed the bacterial and fungal metabarcode derived Nanopore reads for you and how you can summarise the data. You will be able to use this protocol as a reference in your methods section.
The 16S primers target bacteria and long-ITS primers target fungi (or so we thought). Check the protocols "PCR reaction of marker regions (a.k.a metabarcodes) for two kingdoms V.1" and "Sequencing fungal and bacterial metabarcodes with native barcoding and Nanopore" for how the sequences were generated including details on the primers used and specific Nanopore sequencing chemistry.
Long-ITS analysis
In brief, we mapped the long-ITS reads against two databases using minimap2 with a winner takes all approach only reporting the best hit in the databases for each read. Not all reads might have a hit in the database as we learned that the primers also amplify plant and human DNA.
The "in-house" database is part of a larger project the Schwessinger group is involved to improve the identification of fungal spores from air-sampled material. This is a collaboration with DAFF, UC, SARDI, and USyd. You can check out the spore traps here as part of the iMapPests project. The database includes about 80 species with TG1 and TG2 being part of it but not TG3 and TG4. The entries in the database were generated using the same primer pairs as we used in class and hence have they same length as the ITS reads we generated.
The UNITE database is a large public database for fungal ITS sequences which mostly focuses on ITS2. It has about 500,000 'specie' entries in the database. You can read up more on the database here (see also the reference section). The database entries are mostly around 600-700 bp long. This database contains pathogens for TG1, TG3, and TG4.
The final goal is to achieve the following:
- Basecall the fast5 files to fastq files.
- Filter fastq files on quality using NanoFilt.
- Assess overall read lengths and quality after filtering using NanoPlot.
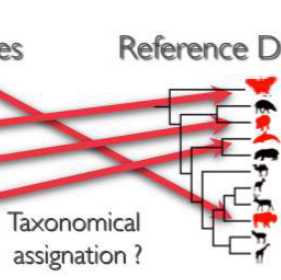
- Map ITS reads separately against the 'in-house' long-ITS and the UNITE ITS2 database using minimap2 and a "winner takes all approach".
- Perform taxonomic assignment of 16S sequences using EMU.
- Critically evaluate taxonomic assignments and summaries them using Excel (shown in class) or R.
Software used for analysis:
- Guppy basecaller; https://nanoporetech.com/how-it-works/basecalling
- NanoFilt; https://github.com/wdecoster/nanofilt
- NanoPlot; https://github.com/wdecoster/NanoPlot
- seqtk; https://github.com/lh3/seqtk
- Minimap2; https://github.com/lh3/minimap2
References:
- Curry, Kristen D., Qi Wang, Michael G. Nute, Alona Tyshaieva, Elizabeth Reeves, Sirena Soriano, Qinglong Wu, et al. “Emu: Species-Level Microbial Community Profiling of Full-Length 16S RRNA Oxford Nanopore Sequencing Data.” Nature Methods 19, no. 7 (July 2022): 845–53. https://doi.org/10.1038/s41592-022-01520-4.
- De Coster, Wouter, Svenn D’Hert, Darrin T Schultz, Marc Cruts, and Christine Van Broeckhoven. “NanoPack: Visualizing and Processing Long-Read Sequencing Data.” Bioinformatics 34, no. 15 (August 1, 2018): 2666–69. https://doi.org/10.1093/bioinformatics/bty149.
- Li, Heng. “Minimap2: Pairwise Alignment for Nucleotide Sequences.” Bioinformatics 34, no. 18 (September 15, 2018): 3094–3100. https://doi.org/10.1093/bioinformatics/bty191.
- Nilsson, Rolf Henrik, Karl-Henrik Larsson, Andy F S Taylor, Johan Bengtsson-Palme, Thomas S Jeppesen, Dmitry Schigel, Peter Kennedy, et al. “The UNITE Database for Molecular Identification of Fungi: Handling Dark Taxa and Parallel Taxonomic Classifications.” Nucleic Acids Research 47, no. D1 (January 8, 2019): D259–64. https://doi.org/10.1093/nar/gky1022.
Guidelines
You must have read, understood, and follow the health and safety instructions provided in the "Overview Mini-Research Project #1 BIOL3106/6106" provided on Wattle (ANU learning portal).
You must have signed and returned one copy of the "Student Safety Declaration Form For Practical Class Work" before starting any laboratory work.
You must have read and understood the Hazard Sheets (Risk assessment) of all chemicals listed bellow in the "Safety Warnings" section. These Hazard Sheets are provided on Wattle as part of the "Overview Mini-Research Project #1 BIOL3106/6106" document.
Troubleshooting
Safety warnings
Get up and walk around to not to sit to long for your analysis.
Before start
You must study the protocol carefully before you start. If anything is unclear post questions directly here on protocols.io.
Data pre-processing
This section gets the raw signal data in the fast5 format into fastq files and filters them down to reasonable junks for you to handle. These reasonable chunks are 10,000 reads for each of your PCR reactions.
All steps were performed in bash on a Linux Ubuntu LTS 20 workstation.
Perform Nanopore basecalling using Guppy, a basecaller software that “translates” raw ion currency signals into nucleotide sequences. Apply the High Accuracy (HAC) basecalling model . Raw sequencing reads were outputted in fastq file into one folder per barcode used. One barcode corresponds to one PCR reaction.
Command
Nanopore basecalling (Linux)
Nanopore basecalling
Filter raw reads on minimum read quality of 10 with NanoFilt. This was applied for each barcode individually.
Command
Filtering reads on a Q-score of 10 (Linux)
Filtering reads on a Q-score of 10
Randomly subsampling of 10,000 filtered reads with seqtk to simplify analysis. The resulting reads are stored in the sub_reads.fastq inside your research groups results folder, which has been renamed as YYYYMMDD.ITS/16S.BC.RG.TG.fastq.
Command
Subsampling of 10,000 reads using seqtk (Linux)
Subsampling of 10,000 reads using seqtk
For each fastq file, a summary statistics report is generated for these reads with NanoPlot.The report is in your results folder with filename ending with NanoPlot-report.html.
Command
NanoPlot (Linux)
NanoPlot
Long-ITS analysis
Long-ITS PCR reads are mapped to the UNITE database and in-house database separately using minimap2, generating two pairwise alignment files (.paf). The paf files are converted to csv format for you, with the filenames ending with UNITE.csv and inhouse.csv [not shown].
Command
Minimap2 against UNITE
Minimap2 against UNITE
Command
Minimap2 against in house long-ITS database
Minimap2 against in house long-ITS database
16S analysis
16S PCR reads were mapped to the emu database using the emu pipeline, which automatically generated a relative abundance file. This has also been converted to csv format for you, Emu.rel-abundance.csv.
Command
EMU based 16S analysis
EMU based 16S analysis
Summary analysis in Excel
Please see ANU learning platform Wattle for additional tips on how to use excel to analyse and summarise your results.