Jul 19, 2024
A CellProfiler computational pipeline to quantify the density of mouse striatal dopaminergic processes
- 1Department of Biochemistry, Stanford University School of Medicine and Aligning Science Across Parkinson's


Protocol Citation: Ebsy Jaimon, Sreeja V Nair, Suzanne R Pfeffer 2024. A CellProfiler computational pipeline to quantify the density of mouse striatal dopaminergic processes. protocols.io https://dx.doi.org/10.17504/protocols.io.x54v92km4l3e/v1
License: This is an open access protocol distributed under the terms of the Creative Commons Attribution License, which permits unrestricted use, distribution, and reproduction in any medium, provided the original author and source are credited
Protocol status: Working
We use this protocol and it's working
Created: July 19, 2024
Last Modified: July 24, 2024
Protocol Integer ID: 103746
Keywords: ASAPCRN, LRRK2, Primary cilia, dorsal striatum
Funders Acknowledgement:
Aligning Science Across Parkinson's
Grant ID: ASAP-000463
Disclaimer
ETHICS DISCLAIMER
The protocols.io team notes that research involving animals and humans must be conducted according to internationally-accepted standards and should always have prior approval from an Institutional Ethics Committee or Board.
Abstract
Here, we present a CellProfiler (1) software pipeline to quantify the density and intensity of dopaminergic processes in the mouse striatum. The dopaminergic processes in the striatum are stained using an anti-tyrosine hydroxylase antibody and the same sections are also stained using an antibody that recognizes total neuronal NeuN (neuronal nuclear antigen biomarker) for staining normalization. For the examples shown herein, images were acquired using a Zeiss LSM 900 laser scanning confocal microscope with a 63X 1.4 oil immersion objective.
(1) Stirling DR, Swain-Bowden MJ, Lucas AM, Carpenter AE, Cimini BA, Goodman A (2021). CellProfiler 4: improvements in speed, utility and usability. BMC Bioinformatics, 22 (1), 433. PMID: 34507520 PMCID: PMC8431850.
Materials
1) .czi files from Zeiss Laser Scanning Microscope
2) FIJI/imageJ
3) CellProfiler software 4.04 or later*
*Stirling DR, Swain-Bowden MJ, Lucas AM, Carpenter AE, Cimini BA, Goodman A (2021). CellProfiler 4: improvements in speed, utility and usability. BMC Bioinformatics, 22 (1), 433. PMID: 34507520 PMCID: PMC8431850.
CellProfiler computational pipeline to quantify the density of mouse striatal dopaminergic processes
CellProfiler computational pipeline to quantify the density of mouse striatal dopaminergic processes
Batch process images
1. Use the FIJI macro as described in dx.doi.org/10.17504/protocols.io.3byl4bpo8vo5/v1 to Z project the .czi images obtained from Zeiss LSM microscope. Open the images that need to be processed, choose the output folder, run code for maximum intensity Z projection, and save the file as .TIFF.
Import files and extract metadata
1. Open CellProfiler. Go to the Images module, drag and drop the maximum intensity projected .TIFF files as indicated. Select “no filtering” in the filter images option.
2. Go to the Metadata module to extract information describing the images.
In the Metadata module:
a) Extract metadata? Yes
b) Metadata extraction method: Extract from image file headers
c) Extract metadata from: All images
d) Hit “Extract metadata”
e) Click on Add another extraction method
f) Metadata extraction method: Extract from file/folder names
g) Metadata source: File name
h) Regular expression to extract from file name:
“Regex” will be as follows:
^.*br(?P<Brain_number>[0-9]{1,2}).*#(?P<image_number>[0-9]{2})for an example file name “br1-01.czi - br1-01.czi #01_max.tif”. This step helps to extract the brain number, and image number from each file name.
In Regex,
^ indicates the beginning of the file name.
(?P<Brain_number>[0-9]{1,2} tells the program to name the captured field “Brain_number” and recognize one or two digits that follow.
.* indicates any character.
(?P<image_number>[0-9]{2}) tells the program to name the captured field “image_number” and recognize two digits that follow.
Click the magnifying glass icon on the right to check the accuracy of regular expression.
i) Metadata data type: Text
j) Click on “update” to populate the metadata field
3. Go to the NamesAndTypes module to give a name to each channel.
a) Assign a name to: Images matching rules
b) Process as 3D: No
c) Match “All” of the following rules
d) Select the rule criteria: “Metadata/Does/Have C matching/0”
e) Name to assign these images: TyrosineHydroxylase
f) Select the image type: Grayscale image
g) Set intensity range from: Image metadata
h) Click on Add another image
i) Match “All” of the following rules
j) Select the rule criteria: “Metadata/Does/Have C matching/1”
k) Name to assign these images: NeuN
l) Select the image type: Grayscale image
m) Set intensity range from: Image metadata
n) Click on “update” to populate the names and types field
4. Go to the Groups module to group the images based on brain number, and image number as identified in the metadata module.
a) Do you want to group your images? Yes
b) Metadata category: Brain_number
c) Click on Add another metadata item
c) Metadata category: image_number
Density measurement
The following steps are used to binarize the images by separating the foreground and background in an image and measuring the area occupied by the foreground in the image.
1. To binarize the images, click on the “+” sign at the bottom left next to Adjust Modules. Under the module category, click Image processing, then choose Threshold module. Click Add to pipeline.
a) Select the input image: TyrosineHydroxylase
b) Name the output image: Thresholded_TyrosineHydroxylase
c) Threshold strategy: Global
d) Thresholding method: Minimum Cross-Entropy
e) Threshold smoothing scale: 0
f) Threshold correction factor: 1
g) Lower and upper bounds on threshold: 0.2 and 1
h) Log transform before thresholding: Yes
Note: Check by clicking “Start Test Mode” and select the green triangle next to the Threshold module each time a parameter is changed to find the best parameters for each image set. Test using multiple images to ensure that the settings work for other images in the project.
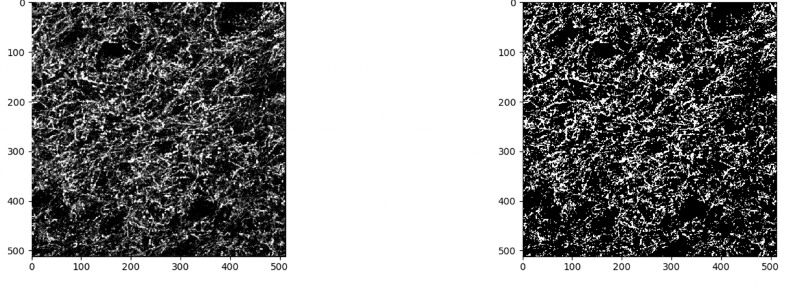
Figure 1. Example of input image (at left) and CellProfiler binarized image (at right).
2. Add MeasureImageAreaOccupied module.
a) Measure the area occupied by: Binary image
b) Select binary images to measure: Thresholded_TyrosineHydroxylase
Intensity measurement
The following steps segment Tyrosine Hydroxylase and NeuN as objects and measure their intensities and areas.
1. To segment Tyrosine Hydroxylase, Add IdentifyPrimaryObjects module.
a) Use advanced settings? Yes
b) Select the input image: TyrosineHydroxylase
c) Name the primary objects to be identified: THobjects
d) Typical diameter of objects, in pixel units (Min, Max): 1,25
e) Discard objects outside the diameter range: Yes
f) Discard objects touching the border of the image: No
g) Threshold strategy: Global
h) Thresholding method: Otsu
i) Two-class or three-class thresholding? Two classes
j) Threshold smoothing scale: 1.3488
k) Threshold correction factor 1
l) Lower and upper bounds on threshold 0.1 and 1.0
m) Log transform before thresholding? No
n) Method to distinguish clumped objects? None
o) Fill holes in identified objects? Never
p) Handling of objects if excessive number of objects identified? Continue
Note: Check by clicking “Start Test Mode” and select the green triangle next to the IdentifyPrimaryObjects module each time a parameter is changed to find the best parameters for each image set. Test using multiple images to ensure that the settings work for other images in the project.
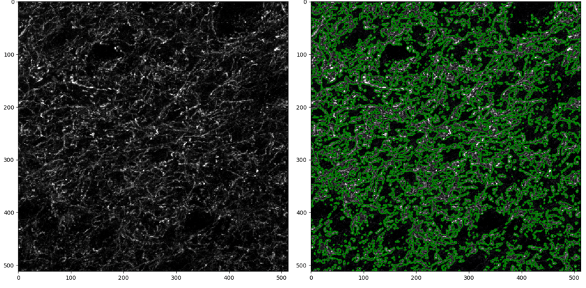
Figure 2: Example of input image (at left) and segmentation of Tyrosine Hydroxylase objects by CellProfiler (at right).
2. To segment NeuN, first add the Smooth module which will help to remove artifacts and make segmentation of NeuN easier.
a) Select the input image: NeuN
b) Name the output image: FilteredImageNeuN
c) Select smoothing method: Median Filter
d) Calculate artifact diameter automatically: Yes
3. Next Add IdentifyPrimaryObjects module to segment NeuN objects.
a) Use advanced settings? Yes
b) Select the input image: FilteredImageNeuN
c) Name the primary objects to be identified: NeuNobjects
d) Typical diameter of objects, in pixel units (Min, Max): 20,200
e) Discard objects outside the diameter range: Yes
f) Discard objects touching the border of the image: No
g) Threshold strategy: Global
h) Thresholding method: Minimum Cross-Entropy
i) Threshold smoothing scale: 1.3488
j) Threshold correction factor 1
k) Lower and upper bounds on threshold 0.07 and 1.0
l) Log transform before thresholding? No
m) Method to distinguish clumped objects? Intensity
n) Method to draw dividing lines between clumped objects: Shape
o) Automatically calculate size of smoothing filter for declumping? Yes
p) Automatically calculate min. allowed distance between local maxima? Yes
q) Speed up by using lower-resolution image to find local maxima? Yes
r) Display accepted local maxima? No
s) Fill holes in identified objects? After both thresholding and declumping
t) Handling of objects if excessive number of objects identified? Continue
Note: Check by selecting “Start Test Mode” and select the green triangle next to the IdentifyPrimaryObjects module each time a parameter is changed to find the best parameters for each image set. Test using multiple images to ensure that the settings work for other images in the project.
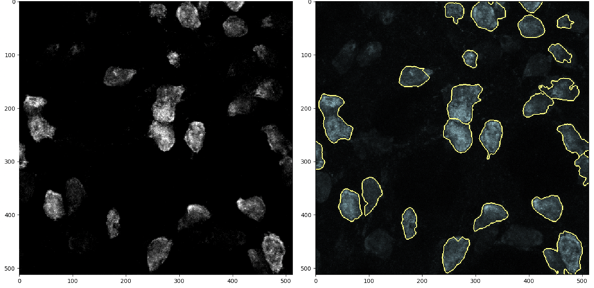
Figure 3: Example of input image (at left) and segmentation of NeuN neurons by CellProfiler (at right).
4. Add MeasureObjectIntensity module to measure integrated intensity of the objects.
a) Select images to measure: Select TyrosineHydroxylase and NeuN
b) Select objects to measure: THobjects and NeuNobjects
5. Add MeasureObjectSizeShape module to measure area of the objects.
a) Select object sets to measure: THobjects and NeuNobjects
b) Calculate Zernike feature? No
c) Calculate the advanced features? No
6. Add the ExportToSpreadsheet module from the + at the bottom to export the measurements into files that can be opened in Excel.
a) Select the column delimiter: Tab
b) Output file location: choose a folder where images will be saved
c) Add a prefix to file names? Yes
d) File name prefix: Add experiment identifier
e) Overwrite existing files without warning? No
f) Add image metadata columns to your object data file? Yes
g) Add image file and folder names to your object data file? No
h) Representation of Nan/Inf: NaN
i) Select measurements to export? Yes
j) Press button to select measurements:
k) Under “Image” choose AreaOccupied -> AreaOccupied -> Thresholded -> TyrosineHydroxylase and choose Metadata -> Brain -> number and image -> number.
Under “NeuNobjects” choose AreaShape -> Area and Intensity -> IntegratedIntensity -> NeuN.
Under “THobjects” choose AreaShape -> Area and Intensity -> IntegratedIntensity -> TyrosineHydroxylase.
l) Calculate the per-image mean values for object measurements? No
m) Calculate the per-image median values for object measurements? No
n) Calculate per-image standard deviation values for object measurements? No
o) Create GenePattern GCT file? No
p) Export all measurement types? No
q) Data to export: Image
r) Use the object name for the file name? Yes
s) Add another data set
t) Data to export: THobjects
u) Use the object name for the file name? Yes
v) Add another data set
w) Data to export: NeuNobjects
x) Combine these object measurements with those of the previous object? Yes
7. Save the pipeline from File-Save Project and click on Analyze Images on the bottom left.
The pipeline will run and export the data to the folder previously specified.
The output .csv file will have distinct columns indicating brain number, image number, image area occupied by Tyrosine hydroxylase, area, and integrated intensity of segmented Tyrosine hydroxylase and NeuN. The values obtained forTyrosine hydroxylase can be further normalized to NeuN staining in the same images if desired.
Protocol references
- Stirling DR, Swain-Bowden MJ, Lucas AM, Carpenter AE, Cimini BA, Goodman A (2021). CellProfiler 4: improvements in speed, utility and usability. BMC Bioinformatics, 22 (1), 433. PMID: 34507520 PMCID: PMC8431850.